Instructions
- To start a simulation, click the [Model/Explore Model] button.
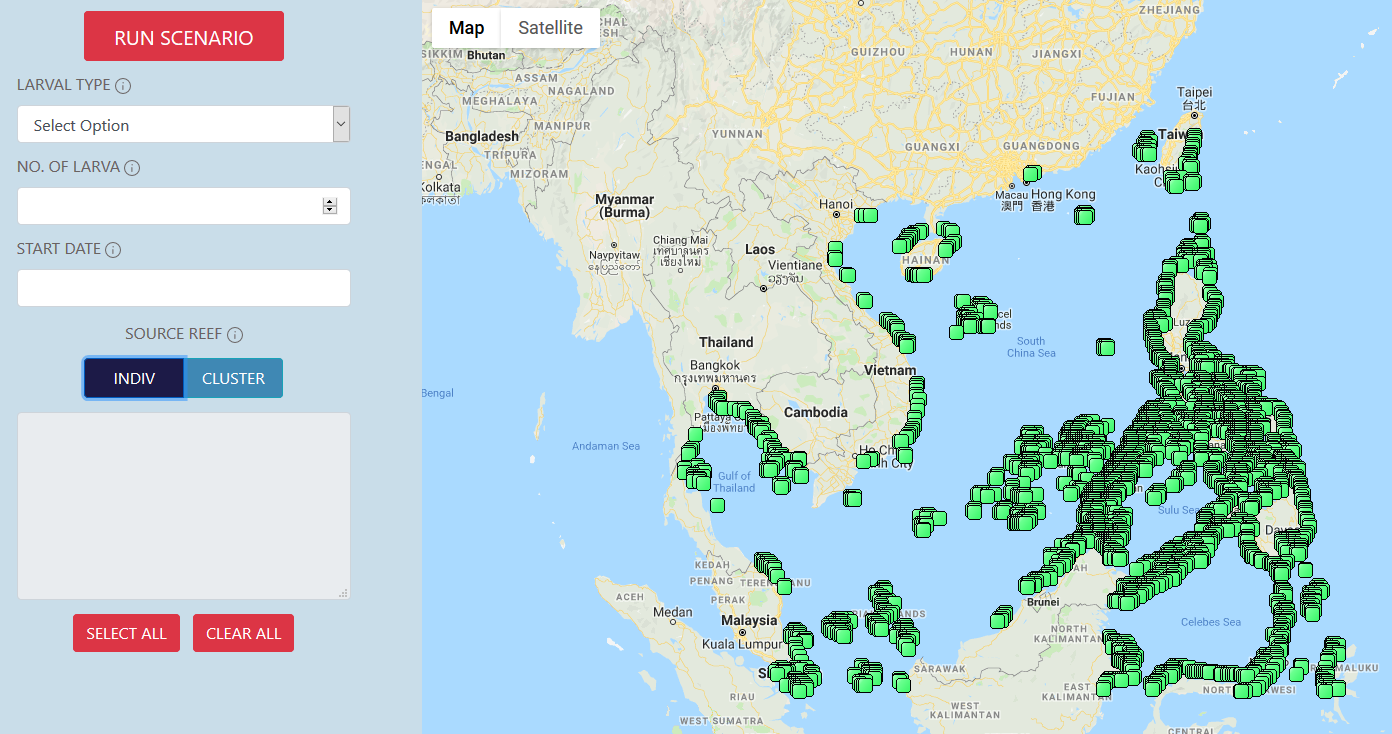
- Select which type of organism (Larval Type) you want to simulate from the drop down button.
- Input the Number of Larva to be released for the simulation. This number represents the number per reef cell.
- Select a date from the drop down calendar when you want the larvae to be spawned.
- Input the reef cell(s) where you want the larvae to come from. Choose between selecting using Individual reef cells or Clusters of reef cells. Once you click on either button, you will be able to see the reef cells. Use the + and - buttons on the map to zoom in or out. You can also pan through different areas of the map by clicking then holding as you move the cursor.
- Use the map on the right side to select the cells, or write their reef ID numbers manually. Click on the individual reef cells or clustered reefs you wish to select, and click again to deselect. To select multiple cells, click then while holding shift, drag across the cells you want to select. You can select all the reef cells by clicking the Select All button or click Clear All to reset the selected reefs.
- When you are satisfied with the parameters, click “Run Scenario”. Please be patient while the model is running. A model run could last several minutes. The actual length of time depends on how many larvae and reef cells you used.
- When the model finishes its run, you will be forwarded to a page wherein you can visualize the source and sink reefs maps, and download the results compressed in a zip file.
- The zip file will contain two .kml files, a info.txt, and a folder containing three csv files.
- The info.txt will contain model parameters selected for the scenario run. Here, you can review which parameters you chose before starting the model.
- The two .kml files are the sources and sinks results of the model. Source reefs are those from which larvae came from at the start of the model. Sink reefs are the reefs where the larvae released eventually settled. You can plot these in Google Earth or GIS software for visualization.
- There are four output .csv files that provide more detailed data that can be further investigated:
- “connectivity_metadata.csv” contains reefs you selected for the model run. It has three columns: the reef cell ID, longitudes, and latitudes
- “connectivity_number_settled_from_sources.csv” contains the number of larvae that settled relative to which reef it came from (source reef). It has four columns: the source reef cell ID, longitudes, latitudes, and number of larvae
- “connectivity_number_settled_to_sinks.csv” contains the number of larvae that settled in a particular reef cell (sink reef). It has four columns: the sink reef cell ID, longitudes, latitudes, and number of larvae
- “connectivity_xyz.csv” identifies the specific pairs of sources and sinks. It contains three columns: source reef ID, sink reef ID, and number of larvae that settled from the source reef to that particular sink reef
Result Map Legend (Percentage of settled larvae):
Source: number of larvae able to settle that came from that reef / total lavae released
Sink: number of larvae that settled on that reef / total lavae released
Applications
This model can be utilized by students, teachers, researchers, coastal resource management practitioners and policy-makers. Teachers may use this for classes in ecology, modeling, and marine science to present concepts of connectivity as well as conduct exercises that can hone critical thinking.
Coastal resource management practitioners and policy-makers can use this tool as a general illustration of connectivity within the Philippines or specific reefs of interest that can give insights into establishing marine protected areas and which reefs influence other reefs. Due to the coarse model resolution and the inherent model simplifications and uncertainties, results should be used with caution.
Disclaimers
We remind the users of this model that while this model is a good estimate of regional reef connectivity, the model simplifies the parameters that affect larval distribution such as complex biological and behavioral aspects of the larvae. The model uses biological characteristics of species per larval type which may not necessarily be accurate for another species of the same larval type. Outcomes should be interpreted and used carefully in recognition of the scope and limitations of the model.
